How to Evaluate Your Machine Learning Models with Python Code!
You’ve finally built your machine learning model to predict future prices of Bitcoin so that you can finally become a multi-billionaire. But how do you know that the model you created is any good?
In this article, I’m going to talk about several ways you can evaluate your machine learning model with code provided! There are two parts to this article:
A) Evaluating Regression Models
B) Evaluating Classification Models
If you don’t know the difference between regression and classification models, check out here.
More specifically, I’m going to cover the following metrics:
- R-Squared
- Adjusted R-Squared
- Mean Absolute Error
- Mean Squared Error
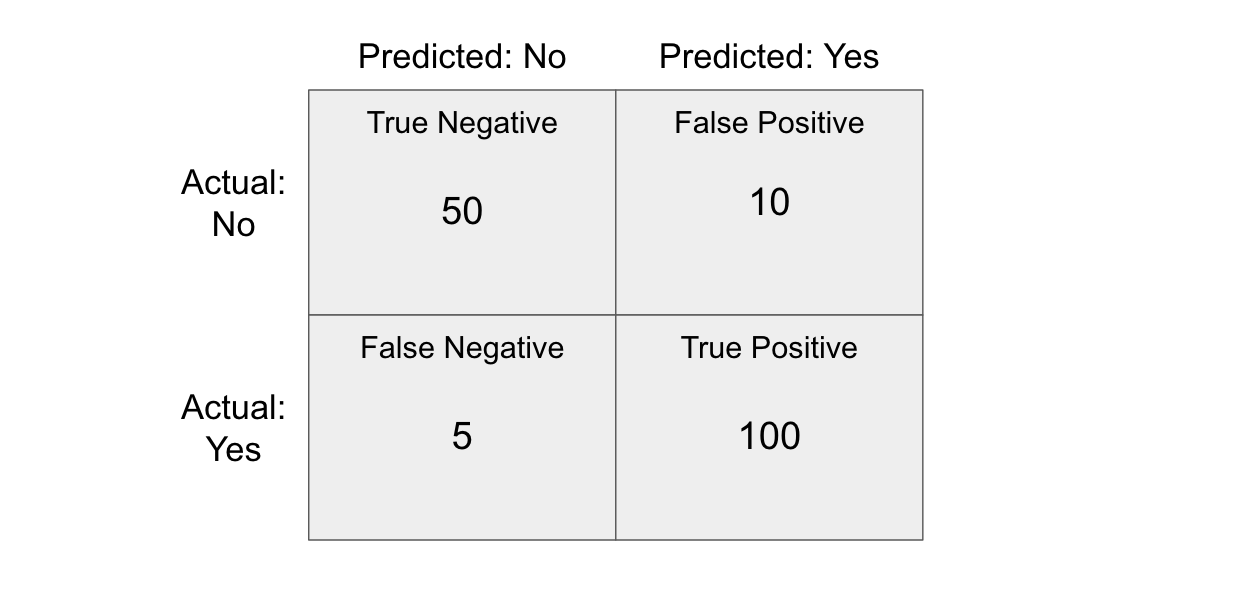
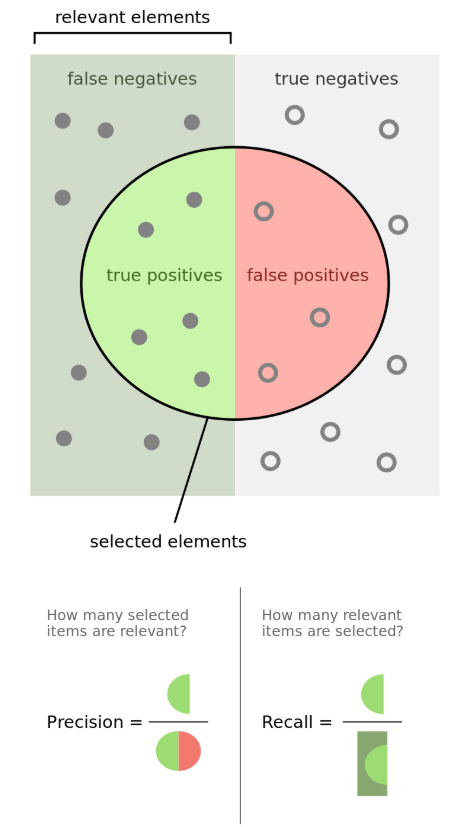
- Confusion Matrix and related metrics
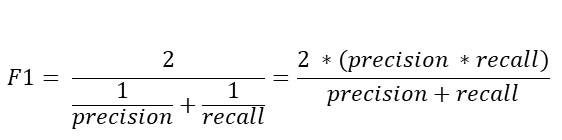
- F1 Score
- AUC-ROC Curve
A) Evaluating Regression Models
1. R-Squared
R Square is a measurement that tells you to what extent the proportion of variance in the dependent variable is explained by the variance in the independent variables. In simpler terms, while the coefficients estimate trends, R-squared represents the scatter around the line of best fit.
For example, if the R² is 0.80, then 80% of the variation can be explained by the model’s inputs.
If the R² is 1.0 or 100%, that means that all movements of the dependent variable can be entirely explained by the movements of the independent variables.
To show a visual example, despite having the same line of best fit, the R² on the right is much higher than the one on the left.
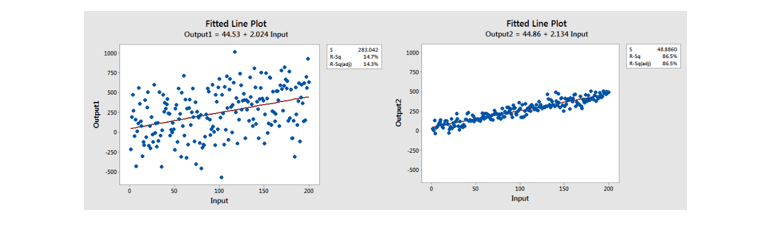
Comparison of a model with a low R² vs a high R²
The equation for R² is as follows:

The Explained Variation is equal to the sum of squared residuals while the total variation is equal to the total sum of squared.

Now that you understand what R² is, the code is very straightforward!
from sklearn.metrics import r2_score
sklearn.metrics.r2_score(y_true, y_pred)
2. Adjusted R-Squared
Every additional independent variable added to a model always increases the R² value — therefore, a model with several independent variables may seem to be a better fit even if it isn’t. This is where Adjusted R² comes in. The adjusted R² compensates for each additional independent variable and only increases if each given variable improves the model above what is possible by probability.
There are a couple of ways to find the adjusted R² with Python:
Option 1: Manual Calculation
# n = number of sample size
# p = number of independent variables Adj_r2 = 1-(1-R2)*(n-1)/(n-p-1)
Option 2: statsmodel.api
import statsmodels.api as sm
from statsmodels.sandbox.regression.predstd import wls_prediction_std model1=sm.OLS(y_train,x_train)
result=model1.fit()
print(result.summary())
3. Mean Absolute Error (MAE)
The absolute error is the difference between the predicted values and the actual values. Thus, the mean absolute error is the average of the absolute error.

By importing mean_absolute_error from sklearn.metrics, you can compute easily compute the MAE of your model.
from sklearn.metrics import mean_absolute_error
mean_absolute_error(y_true, y_pred)
4. Mean Squared Error (MSE)
The mean squared error or MSE is similar to the MAE, except you take the average of the squared differences between the predicted values and the actual values.
Because the differences are squared, larger errors are weighted more highly, and so this should be used over the MAE when you want to minimize large errors. Below is the equation for MSE, as well as the code.

from sklearn.metrics import mean_squared_error
mean_squared_error(y_true, y_pred)