
All Machine Learning Models Explained in 6 Minutes
In my previous article, I explained what regression was and showed how it could be used in application. This week, I’m going to go over the majority of common machine learning models used in practice, so that I can spend more time building and improving models rather than explaining the theory behind it. Let’s dive into it.
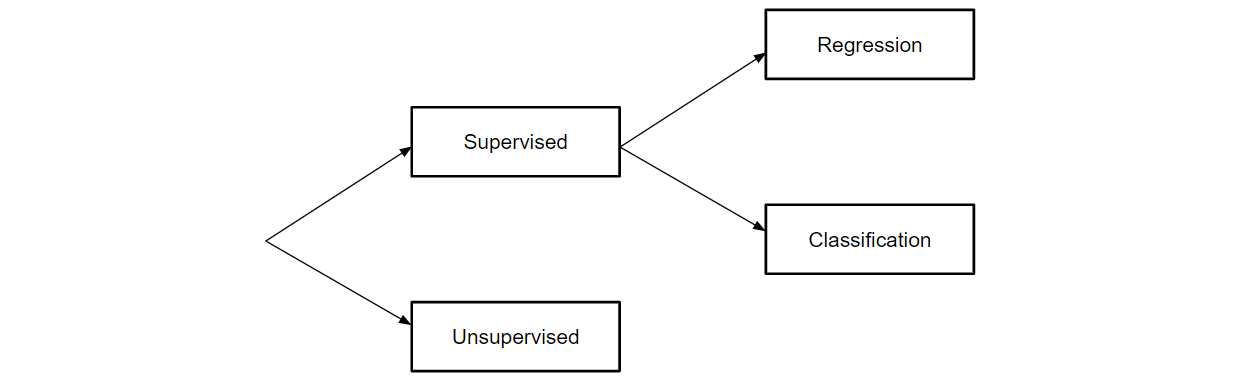
Fundamental Segmentation of Machine Learning Models
All machine learning models are categorized as either supervised or unsupervised. If the model is a supervised model, it’s then sub-categorized as either a regression or classification model. We’ll go over what these terms mean and the corresponding models that fall into each category below.
Supervised Learning
Supervised learning involves learning a function that maps an input to an output based on example input-output pairs [1].
For example, if I had a dataset with two variables, age (input) and height (output), I could implement a supervised learning model to predict the height of a person based on their age.
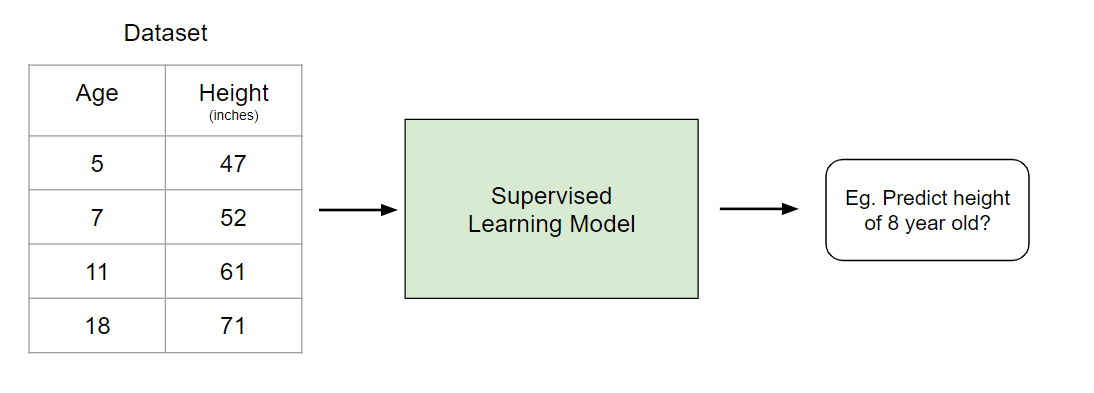
Example of Supervised Learning
To re-iterate, within supervised learning, there are two sub-categories: regression and classification.
Regression
In regression models, the output is continuous. Below are some of the most common types of regression models.
Linear Regression
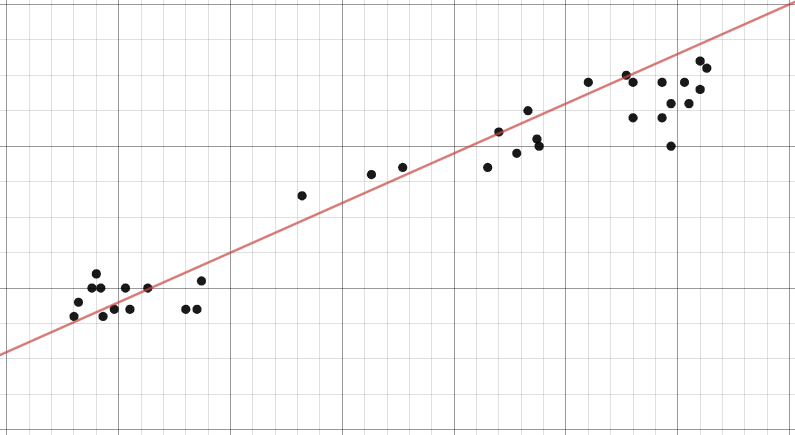
Example of Linear Regression
The idea of linear regression is simply finding a line that best fits the data. Extensions of linear regression include multiple linear regression (eg. finding a plane of best fit) and polynomial regression (eg. finding a curve of best fit). You can learn more about linear regression in my previous article.
Decision Tree
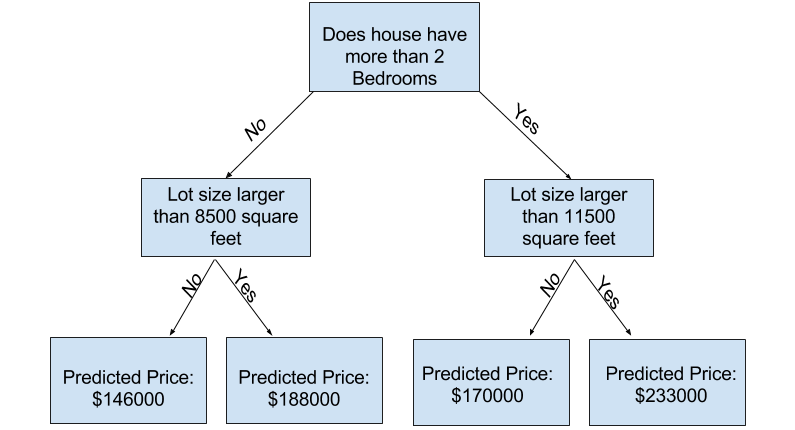
Image taken from Kaggle
Decision trees are a popular model, used in operations research, strategic planning, and machine learning. Each square above is called a node, and the more nodes you have, the more accurate your decision tree will be (generally). The last nodes of the decision tree, where a decision is made, are called the leaves of the tree. Decision trees are intuitive and easy to build but fall short when it comes to accuracy.
Random Forest
Random forests are an ensemble learning technique that builds off of decision trees. Random forests involve creating multiple decision trees using bootstrapped datasets of the original data and randomly selecting a subset of variables at each step of the decision tree. The model then selects the mode of all of the predictions of each decision tree. What’s the point of this? By relying on a “majority wins” model, it reduces the risk of error from an individual tree.
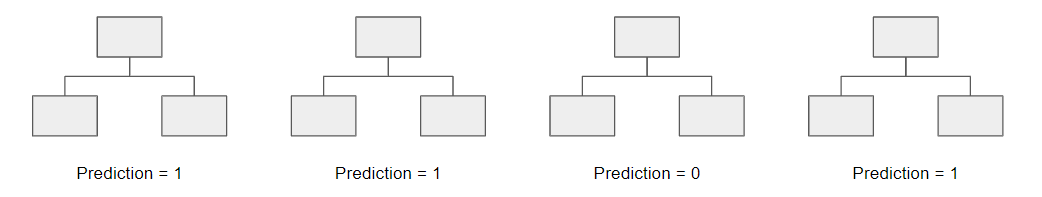
For example, if we created one decision tree, the third one, it would predict 0. But if we relied on the mode of all 4 decision trees, the predicted value would be 1. This is the power of random forests.
StatQuest does an amazing job walking through this in greater detail. See here.
Neural Network
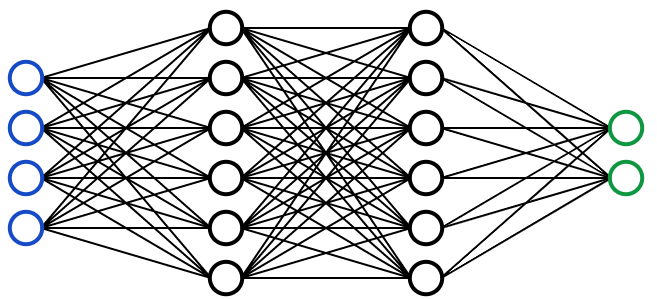
Visual Representation of a Neural Network
A Neural Network is essentially a network of mathematical equations. It takes one or more input variables, and by going through a network of equations, results in one or more output variables. You can also say that a neural network takes in a vector of inputs and returns a vector of outputs, but I won’t get into matrices in this article.
The blue circles represent the input layer, the black circles represent the hidden layers, and the green circles represent the output layer. Each node in the hidden layers represents both a linear function and an activation function that the nodes in the previous layer go through, ultimately leading to an output in the green circles.
- If you would like to learn more about it, check out my beginner-friendly explanation on neural networks.
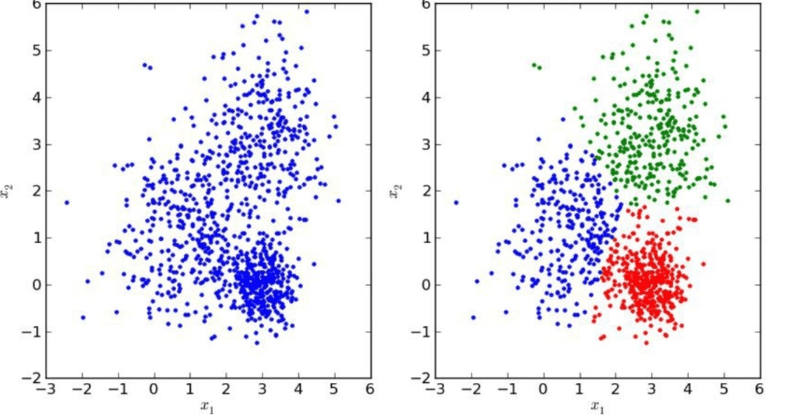
Classification
In classification models, the output is discrete. Below are some of the most common types of classification models.
Logistic Regression
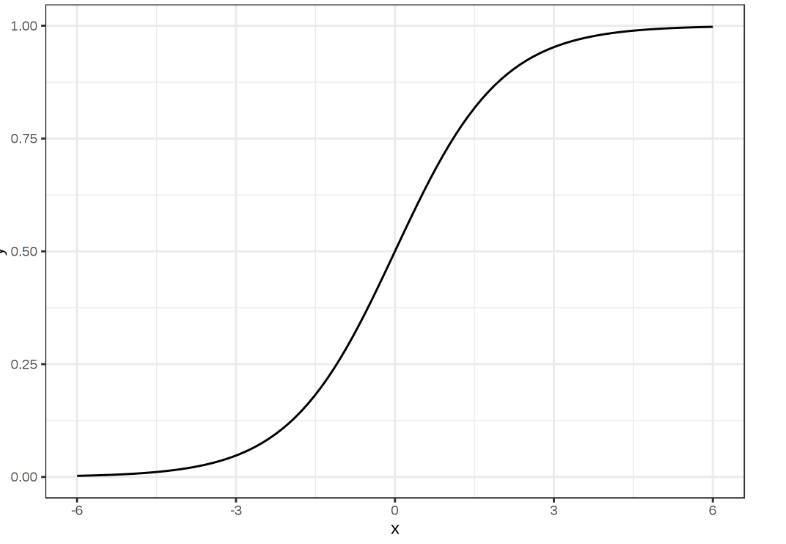
Logistic regression is similar to linear regression but is used to model the probability of a finite number of outcomes, typically two. There are a number of reasons why logistic regression is used over linear regression when modeling probabilities of outcomes (see here). In essence, a logistic equation is created in such a way that the output values can only be between 0 and 1 (see below).
Support Vector Machine
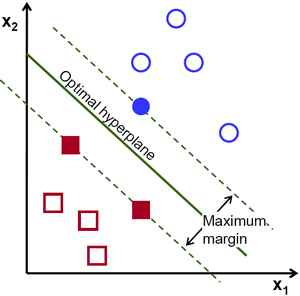
A Support Vector Machine is a supervised classification technique that can actually get pretty complicated but is pretty intuitive at the most fundamental level.
Let’s assume that there are two classes of data. A support vector machine will find a hyperplane or a boundary between the two classes of data that maximizes the margin between the two classes (see below). There are many planes that can separate the two classes, but only one plane can maximize the margin or distance between the classes.
If you want to get into greater detail, Savan wrote a great article on Support Vector Machines here.
Naive Bayes
Naive Bayes is another popular classifier used in Data Science. The idea behind it is driven by Bayes Theorem:

In plain English, this equation is used to answer the following question. “What is the probability of y (my output variable) given X? And because of the naive assumption that variables are independent given the class, you can say that:
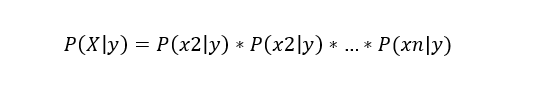
As well, by removing the denominator, we can then say that P(y|X) is proportional to the right-hand side.

Therefore, the goal is to find the class y with the maximum proportional probability.
Check out my article “A Mathematical Explanation of Naive Bayes” if you want a more in-depth explanation!
Decision Tree, Random Forest, Neural Network
These models follow the same logic as previously explained. The only difference is that that output is discrete rather than continuous.
Unsupervised Learning
Unlike supervised learning, unsupervised learning is used to draw inferences and find patterns from input data without references to labeled outcomes. Two main methods used in unsupervised learning include clustering and dimensionality reduction.
Clustering
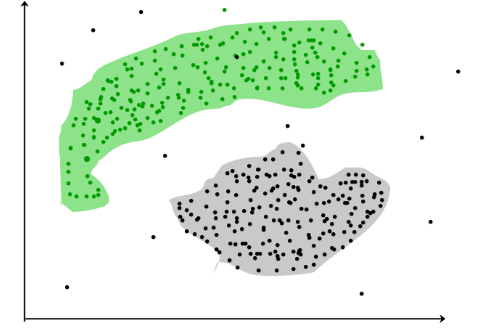
Taken from GeeksforGeeks
Clustering is an unsupervised technique that involves the grouping, or clustering, of data points. It’s frequently used for customer segmentation, fraud detection, and document classification.
Common clustering techniques include k-means clustering, hierarchical clustering, mean shift clustering, and density-based clustering. While each technique has a different method in finding clusters, they all aim to achieve the same thing.
Dimensionality Reduction
Dimensionality reduction is the process of reducing the number of random variables under consideration by obtaining a set of principal variables [2]. In simpler terms, its the process of reducing the dimension of your feature set (in even simpler terms, reducing the number of features). Most dimensionality reduction techniques can be categorized as either feature elimination or feature extraction.
A popular method of dimensionality reduction is called principal component analysis.
Principal Component Analysis (PCA)
In the simplest sense, PCA involves project higher dimensional data (eg. 3 dimensions) to a smaller space (eg. 2 dimensions). This results in a lower dimension of data, (2 dimensions instead of 3 dimensions) while keeping all original variables in the model.
There is quite a bit of math involved with this. If you want to learn more about it…
Check out this awesome article on PCA here.
If you’d rather watch a video, StatQuest explains PCA in 5 minutes here.
Conclusion
Obviously, there is a ton of complexity if you dive into any particular model, but this should give you a fundamental understanding of how each machine learning algorithm works!
Here at Datatron, we offer a platform to govern and manage all of your Machine Learning, Artificial Intelligence, and Data Science Models in Production. Additionally, we help you automate, optimize, and accelerate your ML models to ensure they are running smoothly and efficiently in production — To learn more about our services be sure to Book a Demo.