Datatron Blog

Stay Current with AI/ML

Blog Category

Confusion Matrix

Understanding the Confusion Matrix for Model Evaluation & Monitoring

Anyone can build a machine learning (ML) model with a few lines of code, but building a good machine learning model is a whole other story.

What do I mean by a GOOD machine learning model?

It depends, but generally, you’ll evaluate your machine learning model based on some predetermined metrics that you decide to use. When it comes to building classification models, you’ll most likely use a confusion matrix and related metrics to evaluate your model. Confusion matrices are not just useful in model evaluation but also model monitoring and model management!

Don’t worry, we’re not talking about linear algebra matrices here!

In this article, we’ll cover what a confusion matrix is, some key terms and metrics, an example of a 2×2 matrix, and all of the related python code.

With that said, let’s dive into it!

What is a Confusion Matrix?

A confusion matrix, also known as an error matrix, is a summarized table used to assess the performance of a classification model. The number of correct and incorrect predictions are summarized with count values and broken down by each class.

Below is an image of the structure of a 2×2 confusion matrix. To give an example, let’s say that there were ten instances where a classification model predicted ‘Yes’ in which the actual value was ‘Yes’. Then the number ten would go in the top left corner in the True Positive quadrant. This leads us to some key terms:

  • Positive (P): Observation is positive (eg. is a dog).
  • Negative (N): Observation is not positive (eg. is not a dog).
  • True Positive (TP): Outcome where the model correctly predicts the positive class.
  • True Negative (TN): Outcome where the model correctly predicts the negative class.
  • False Positive (FP): Also called a type 1 error, an outcome where the model incorrectly predicts the positive class when it is actually negative.
  • False Negative (FN): Also called a type 2 error, an outcome where the model incorrectly predicts the negative class when it is actually positive.
Infographic

MLOps Maturity Model [M3]

MLOps Maturity Model Infographic Thumbnail

In this Infographic, you’ll learn:

  • The FIVE stages of maturity in Machine Learning Operations, i.e., MLOps
  • Why DevOps is not the same for ML as it is for software, and why MLOps is needed
  • The ideal teams, stacks, and features to look for to reach Maturity in your ML program

Learn why some companies succeed, while others struggle in AI/ML by seeing the signatures of success across Ideation, Team, Stack, Process, & Outcome in this informative (Hi-res) Infographic.

Infographic: MLOps Maturity Model [M3]

Confusion Matrix Metrics

Now that you understand the general structure of a confusion matrix as well as the associated key terms, we can dive into some of the main metrics that you can calculate from a confusion matrix.

Note: this list is not exhaustive — if you want to see all of the metrics that you can calculate, check out Wikipedia’s page.

Accuracy

This is simply equal to the proportion of predictions that the model classified correctly.

Precision

Precision is also known as positive predictive value and is the proportion of relevant instances among the retrieved instances. In other words, it answers the question “What proportion of positive identifications was actually correct?”

Recall

Recall, also known as the sensitivity, hit rate, or the true positive rate (TPR), is the proportion of the total amount of relevant instances that were actually retrieved. It answers the question “What proportion of actual positives was identified correctly?”

To really hit it home, the diagram below is a great way to remember the difference between precision and recall (it certainly helped me)!

Specificity

Specificity, also known as the true negative rate (TNR), measures the proportion of actual negatives that are correctly identified as such. It is the opposite of recall.

F1 Score

The F1 score is a measure of a test’s accuracy — it is the harmonic mean of precision and recall. It can have a maximum score of 1 (perfect precision and recall) and a minimum of 0. Overall, it is a measure of the preciseness and robustness of your model.

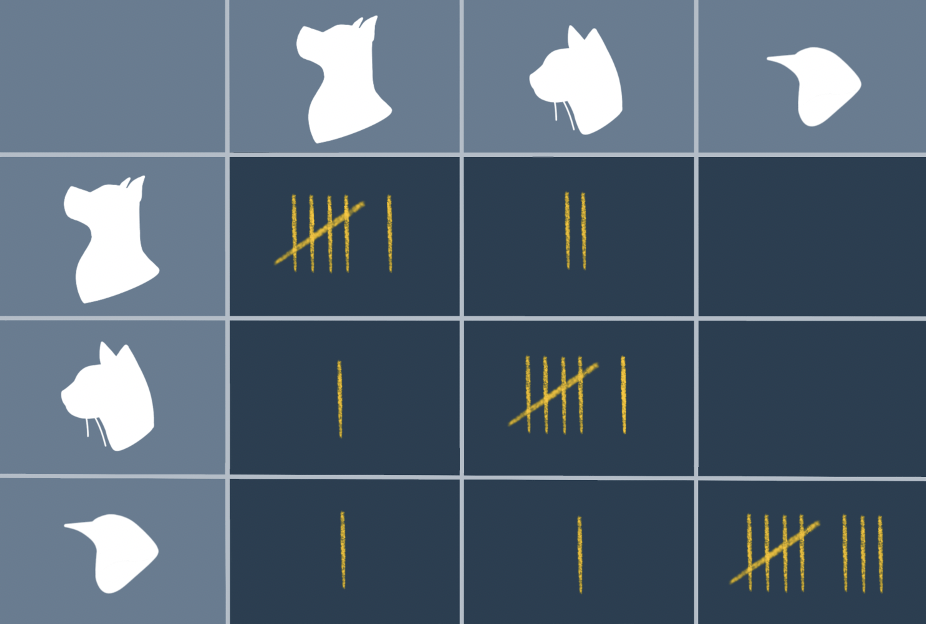
Example of 2×2 Confusion Matrix

If this still isn’t making sense to you, it will after we take a look at the example below.

Imagine that we created a machine learning model that predicts whether a patient has cancer or not. The table on the left shows twelve predictions that the model made as well as the actual result of each patient. With our paired-data, you can then fill out the confusion matrix using the structure that I showed above.

Once this is filled in, we can learn a number of things about our model:

  • Our model predicted that 4/12 (red + yellow) patients had cancer when there were actually 3/12 (red + blue) patients with cancer
  • Our model has an accuracy of 9/12 or 75% ((red + green)/(total))
  • The recall of our model is equal to 2/(2+1) = 66%

In reality, you would want the recall of a cancer detection model to be as close to 100% as possible. It’s far worse if a patient with cancer is diagnosed as cancer-free, as opposed to a cancer-free patient being diagnosed with cancer only to realize later with more testing that he/she doesn’t have it.

Python Code

Below is a summary of code that you need to calculate the metrics above:

# Confusion Matrix

from sklearn.metrics import confusion_matrix

confusion_matrix(y_true, y_pred)

# Accuracy

from sklearn.metrics import accuracy_score

accuracy_score(y_true, y_pred)

# Recall

from sklearn.metrics import recall_score

recall_score(y_true, y_pred, average=None)

# Precision

from sklearn.metrics import precision_score

precision_score(y_true, y_pred, average=None)

There are three ways you can calculate the F1 score in Python:

# Method 1: sklearn

from sklearn.metrics import f1_score

f1_score(y_true, y_pred, average=None)

# Method 2: Manual Calculation

F1 = 2 * (precision * recall) / (precision + recall)

# Method 3: Classification report [BONUS]

from sklearn.metrics import classification_report

print(classification_report(y_true, y_pred, target_names=target_names))

Conclusion

Now that you know what a confusion matrix is as well as its associated metrics, you can effectively evaluate your classification ML models. This is also essential to understand even after you finish developing your ML model, as you’ll be leveraging these metrics in the model monitoring and model management stages of the machine learning life cycle.

Here at Datatron, we offer a platform to govern and manage all of your Machine Learning, Artificial Intelligence, and Data Science Models in Production. Additionally, we help you automate, optimize, and accelerate your ML models to ensure they are running smoothly and efficiently in production — To learn more about our services be sure to Book a Demo.

Thanks for Reading!

Infographic

MLOps Maturity Model [M3]

MLOps Maturity Model Infographic Thumbnail

In this Infographic, you’ll learn:

  • The FIVE stages of maturity in Machine Learning Operations, i.e., MLOps
  • Why DevOps is not the same for ML as it is for software, and why MLOps is needed
  • The ideal teams, stacks, and features to look for to reach Maturity in your ML program

Learn why some companies succeed, while others struggle in AI/ML by seeing the signatures of success across Ideation, Team, Stack, Process, & Outcome in this informative (Hi-res) Infographic.

Infographic: MLOps Maturity Model [M3]

whitepaper

Datatron 3.0 Product Release – Enterprise Feature Enhancements

Streamlined features that improve operational workflows, enforce enterprise-grade security, and simplify troubleshooting.

Get Whitepaper

whitepaper

Datatron 3.0 Product Release – Simplified Kubernetes Management

Eliminate the complexities of Kubernetes management and deploy new virtual private cloud environments in just a few clicks.

Get Whitepaper

whitepaper

Datatron 3.0 Product Release – JupyterHub Integration

Datatron continues to lead the way with simplifying data scientist workflows and delivering value from AI/ML with the new JupyterHub integration as part of the “Datatron 3.0” product release.

Get Whitepaper

whitepaper

Success Story: Global Bank Monitors 1,000’s of Models On Datatron

A top global bank was looking for an AI Governance platform and discovered so much more. With Datatron, executives can now easily monitor the “Health” of thousands of models, data scientists decreased the time required to identify issues with models and uncover the root cause by 65%, and each BU decreased their audit reporting time by 65%.

Get Whitepaper

whitepaper

Success Story: Domino’s 10x Model Deployment Velocity

Domino’s was looking for an AI Governance platform and discovered so much more. With Datatron, Domino’s accelerated model deployment 10x, and achieved 80% more risk-free model deployments, all while giving executives a global view of models and helping them to understand the KPI metrics achieved to increase ROI.

Get Whitepaper

whitepaper

5 Reasons Your AI/ML Models are Stuck in the Lab

AI/ML Executive need more ROI from AI/ML? Data Scientist want to get more models into production? ML DevOps Engineer/IT want an easier way to manage multiple models. Learn how enterprises with mature AI/ML programs overcome obstacles to operationalize more models with greater ease and less manpower.

Get Whitepaper