The Confusion Matrix
Photo by @honeyyanibel on Unsplash
Artificial Intelligence (AI) has been framed as the solution to some of mankind’s most complex problems on earth. From recommendation engines, to digital assistance, to self-driving cars, etc., it’s to adopt the misconception that AI systems are blameless which in reality is very far from the truth.
When a company decides to adopt AI into their workflow, more often than not, it is an action taken in hopes of driving business value. However, knowledge that AI algorithms are not void of errors is one of the first steps towards generating that value. The next step is understanding what errors your Machine Learning algorithm is making as this presents an opportunity to further improve the algorithm and create a model that drives business value with minimal errors – ideally less than a human would make in the same scenario.
Whenever Data Scientists or Machine Learning practitioners wish to evaluate the effectiveness of their model, they turn to evaluation metrics. There are many common evaluation metrics such as log loss, area under the curve (AUC), and mean squared error- although businesses may decide to design their own metrics which align with their business problem and KPI’s. A popular performance measurement for classification tasks is the Confusion Matrix.
What is the Confusion Matrix?
A confusion matrix is a performance measurement tool, often used for machine learning classification tasks where the output of the model could be 2 or more classes (i.e. binary classification and multiclass classification). The confusion matrix is especially useful when measuring recall, precision, specificity, accuracy, and the AUC of a classification model.
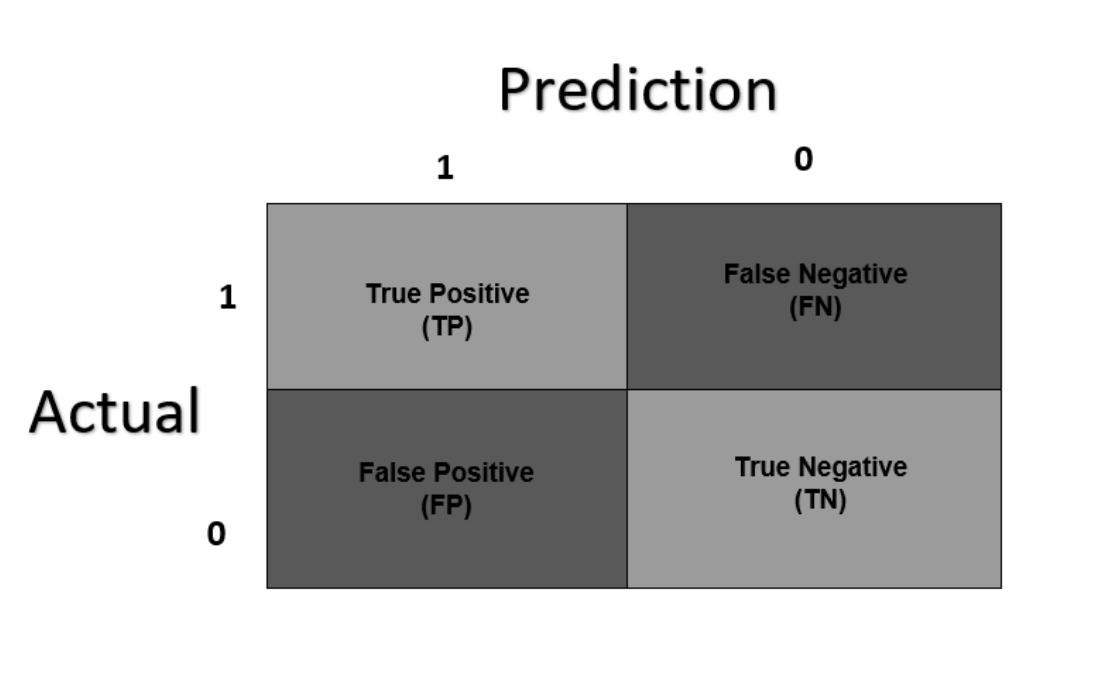
To conceptualize the confusion matrix better, it’s best to grasp the intuitions of its use for a binary classification problem. Without any annotations, the confusion matrix would look as follows:
NoteIgnore the colours for now and also be aware that various sources structure the confusion matrix differently. For instance, some sources may have that the rows of the confusion matrix will determine the predicted values, and the columns are the actual values.
Example Use Case
Some may argue that there is no value in using machine learning to predict whether an image displays a dog or a cat. Nevertheless, it makes one heck of an example and we will be using it today.
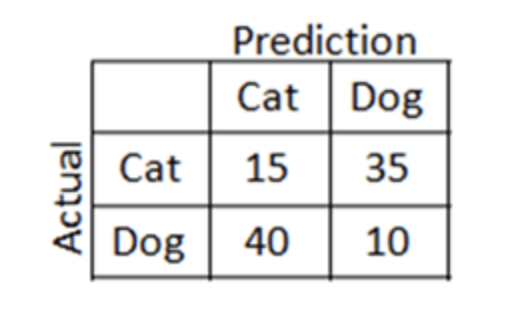
We’ve spent hours doing feature engineering and have finally fitted our model on our dataset to learn how to distinguish between a dog and a cat. We then used our validation data as a proxy of unseen data to evaluate how well our algorithm has learned to spot the difference between cats and dogs. Once we have our predictions, we build a confusion matrix…

By summing the rows, the first thing we realize is that there are 50 cat images and 50 dog images. However, of the 50 cat images, our algorithm only correctly predicted 15 cat images to be of cats and the other 35 to be dogs. On the other hand, the algorithm predicted only 10 of the 50 dog images to be dogs, meaning it got a whopping 40 images wrong. A visual way to identify the correct prediction made by our algorithm is to look at the diagonal columns [starting from the top left corner] – this is the reason the diagonal boxes in the previous images were shaded different colors.
It’s pretty clear to see that our model is performing quite badly, but as a Data Scientists, describing a model as “quite bad” is not objective. We need a way to quantify our results.


