A Simple Guide to A/B Testing for Data Science
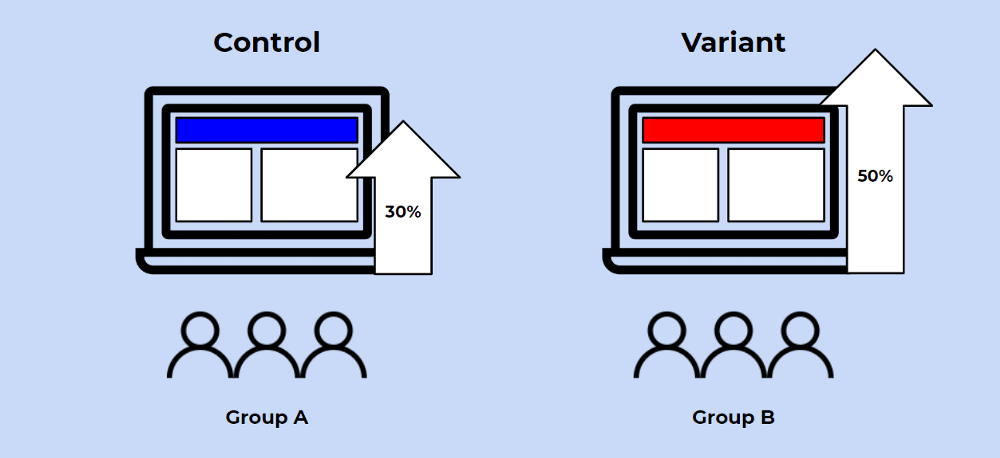
Picture created by myself, Terence Shin, and Freepik
Check out my article ‘Hypothesis Testing Explained as Simply as Possible’ if you don’t already know what hypothesis testing is first!
A/B testing is one of the most important concepts in data science and in the tech world in general because it is one of the most effective methods in making conclusions about any hypothesis one may have. It’s important that you understand what A/B testing is and how it generally works.
Table of Contents
What is A/B testing?
A/B testing in its simplest sense is an experiment on two variants to see which performs better based on a given metric. Typically, two consumer groups are exposed to two different versions of the same thing to see if there is a significant difference in metrics like sessions, click-through rate, and/or conversions.
Using the visual above as an example, we could randomly split our customer base into two groups, a control group and a variant group. Then, we can expose our variant group with a red website banner and see if we get a significant increase in conversions. It’s important to note that all other variables need to be held constant when performing an A/B test.
Getting more technical, A/B testing is a form of statistical and two-sample hypothesis testing. Statistical hypothesis testing is a method in which a sample dataset is compared against the population data. Two-sample hypothesis testing is a method in determining whether the differences between the two samples are statistically significant or not.
Why is it important to know?
It’s important to know what A/B testing is and how it works because it’s the best method in quantifying changes in a product or changes in a marketing strategy. And this is becoming increasingly important in a data-driven world where business decisions need to be back by facts and numbers.
How to conduct a standard A/B test
1. Formulate your hypothesis
Before conducting an A/B testing, you want to state your null hypothesis and alternative hypothesis:
The null hypothesis is one that states that sample observations result purely from chance. From an A/B test perspective, the null hypothesis states that there is no difference between the control and variant group.
The alternative hypothesis is one that states that sample observations are influenced by some non-random cause. From an A/B test perspective, the alternative hypothesis states that there is a difference between the control and variant group.
When developing your null and alternative hypotheses, it’s recommended that you follow a PICOT format. Picot stands for:
- Population: the group of people that participate in the experiment
- Intervention: refers to the new variant in the study
- Comparison: refers to what you plan on using as a reference group to compare against your intervention
- Outcome: represents what result you plan on measuring
- Time: refers to the duration of the experience (when and how long the data is collected)
Example: “Intervention A will improve anxiety (as measured by the mean change from baseline in the HADS anxiety subscale) in cancer patients with clinical levels of anxiety at 3 months compared to the control intervention.”
Does it follow the PICOT criteria?
- Population: Cancer patients with clinical levels of anxiety
- Intervention: Intervention A
- Comparison: the control intervention
- Outcome: improve anxiety as measured by the mean change from baseline in the HADS anxiety subscale
- Time: at 3 months compared to the control intervention.
Yes it does — therefore, this is an example of a strong hypothesis test.
2. Create your control group and test group
Once you determine your null and alternative hypothesis, the next step is to create your control and test (variant) group. There are two important concepts to consider in this step, random samplings and sample size.
Random Sampling
Random sampling is a technique where each sample in a population has an equal chance of being chosen. Random sampling is important in hypothesis testing because it eliminates sampling bias, and it’s important to eliminate bias because you want the results of your A/B test to be representative of the entire population rather than the sample itself.
Sample Size
It’s essential that you determine the minimum sample size for your A/B test prior to conducting it so that you can eliminate under coverage bias, bias from sampling too few observations. There are plenty of online calculators that you can use to calculate the sample size given these three inputs.
3. Conduct the test, compare the results, and reject or do not reject the null hypothesis

Once you conduct your experiment and collect your data, you want to determine if the difference between your control group and variant group is statistically significant. There are a few steps in determining this:
- First, you want to set your alpha, the probability of making a type 1 error. Typically the alpha is set at 5% or 0.05
- Next, you want to determine the probability value (p-value) by first calculating the t-statistic using the formula above.
- Lastly, compare the p-value to the alpha. If the p-value is greater than the alpha, do not reject the null!
If this doesn’t make sense to you, I would take the time to learn more about hypothesis testing here!
For more articles like this one, check out https://datatron.com/blog
Thanks for reading!
Here at Datatron, we offer a platform to govern and manage all of your Machine Learning, Artificial Intelligence, and Data Science Models in Production. Additionally, we help you automate, optimize, and accelerate your ML models to ensure they are running smoothly and efficiently in production — To learn more about our services be sure to Book a Demo.

