Datatron Blog

Stay Current with AI/ML

The Confusion Matrix

The Confusion Matrix

Photo by @honeyyanibel on Unsplash

Artificial Intelligence (AI) has been framed as the solution to some of mankind’s most complex problems on earth. From recommendation engines, to digital assistance, to self-driving cars, etc., it’s to adopt the misconception that AI systems are blameless which in reality is very far from the truth.

When a company decides to adopt AI into their workflow, more often than not, it is an action taken in hopes of driving business value. However, knowledge that AI algorithms are not void of errors is one of the first steps towards generating that value. The next step is understanding what errors your Machine Learning algorithm is making as this presents an opportunity to further improve the algorithm and create a model that drives business value with minimal errors – ideally less than a human would make in the same scenario.

Whenever Data Scientists or Machine Learning practitioners wish to evaluate the effectiveness of their model, they turn to evaluation metrics. There are many common evaluation metrics such as log loss, area under the curve (AUC), and mean squared error- although businesses may decide to design their own metrics which align with their business problem and KPI’s. A popular performance measurement for classification tasks is the Confusion Matrix.

What is the Confusion Matrix?

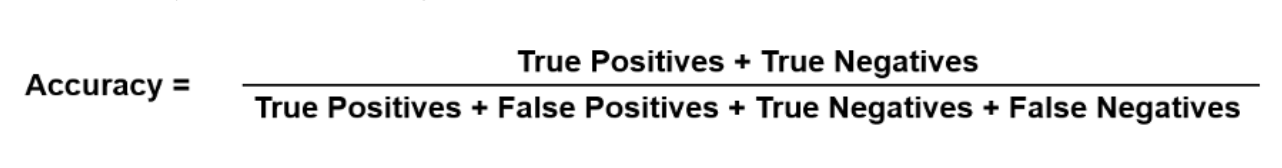
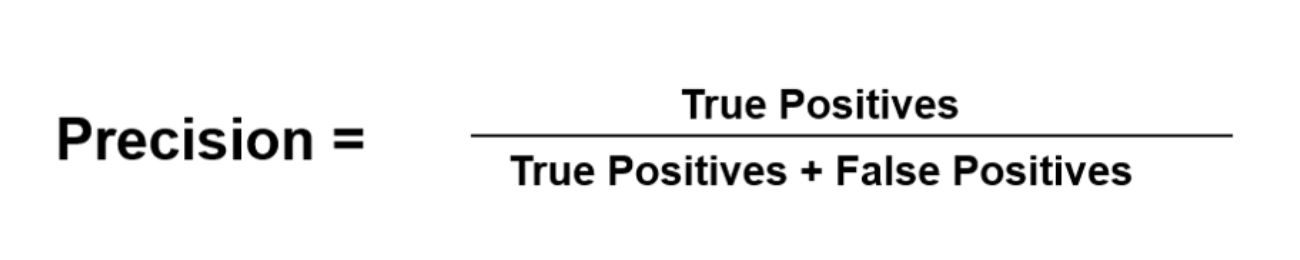
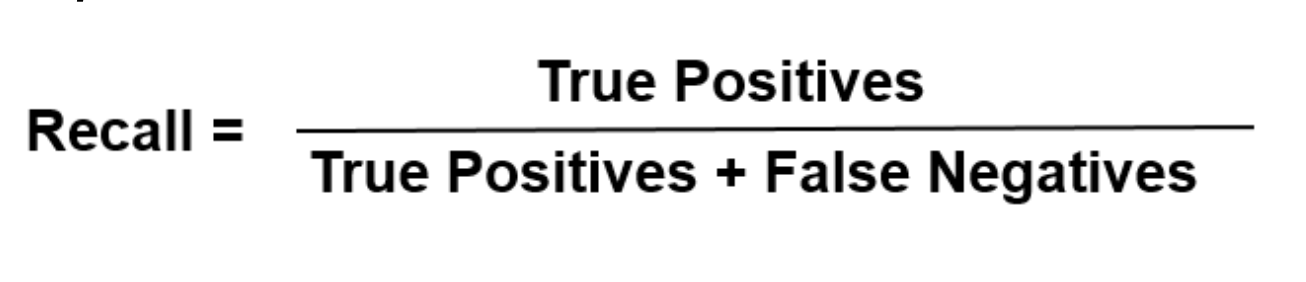
A confusion matrix is a performance measurement tool, often used for machine learning classification tasks where the output of the model could be 2 or more classes (i.e. binary classification and multiclass classification). The confusion matrix is especially useful when measuring recall, precision, specificity, accuracy, and the AUC of a classification model.

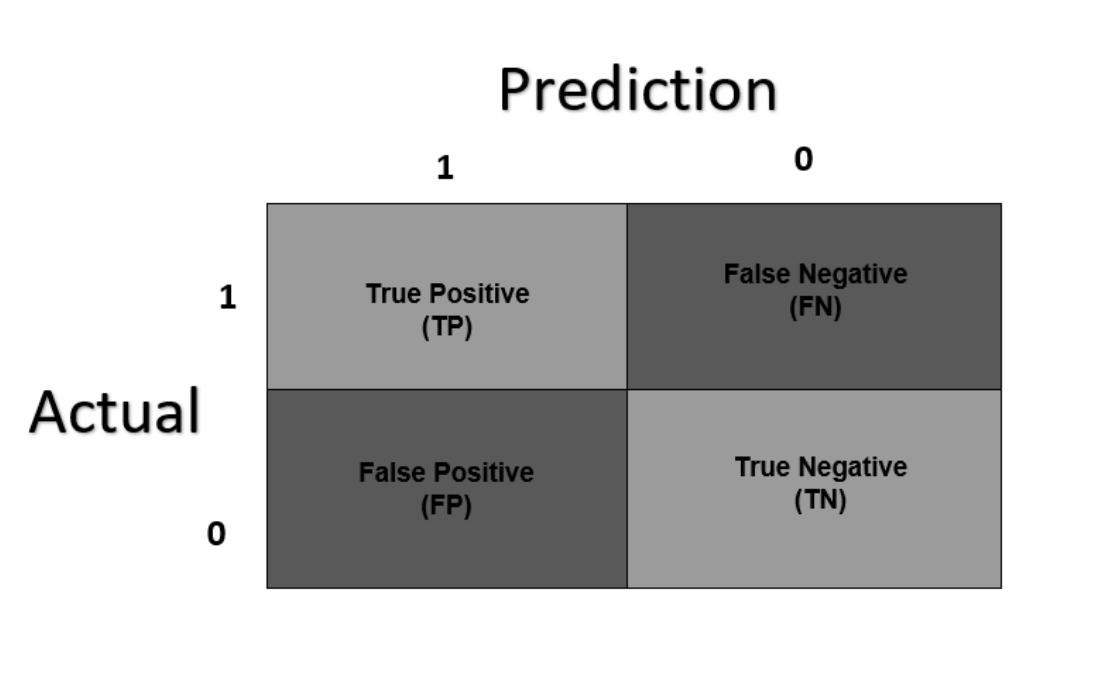
To conceptualize the confusion matrix better, it’s best to grasp the intuitions of its use for a binary classification problem. Without any annotations, the confusion matrix would look as follows:

NoteIgnore the colours for now and also be aware that various sources structure the confusion matrix differently. For instance, some sources may have that the rows of the confusion matrix will determine the predicted values, and the columns are the actual values.

Example Use Case

Some may argue that there is no value in using machine learning to predict whether an image displays a dog or a cat. Nevertheless, it makes one heck of an example and we will be using it today.

We’ve spent hours doing feature engineering and have finally fitted our model on our dataset to learn how to distinguish between a dog and a cat. We then used our validation data as a proxy of unseen data to evaluate how well our algorithm has learned to spot the difference between cats and dogs. Once we have our predictions, we build a confusion matrix…

actual prediction

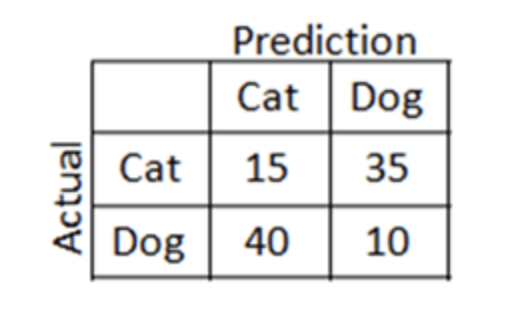
By summing the rows, the first thing we realize is that there are 50 cat images and 50 dog images. However, of the 50 cat images, our algorithm only correctly predicted 15 cat images to be of cats and the other 35 to be dogs. On the other hand, the algorithm predicted only 10 of the 50 dog images to be dogs, meaning it got a whopping 40 images wrong. A visual way to identify the correct prediction made by our algorithm is to look at the diagonal columns [starting from the top left corner] – this is the reason the diagonal boxes in the previous images were shaded different colors.

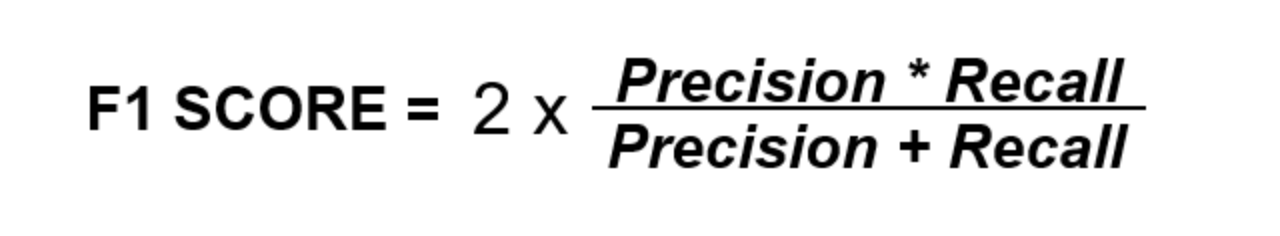
It’s pretty clear to see that our model is performing quite badly, but as a Data Scientists, describing a model as “quite bad” is not objective. We need a way to quantify our results.

Infographic

MLOps Maturity Model [M3]

MLOps Maturity Model Infographic Thumbnail

In this Infographic, you’ll learn:

  • The FIVE stages of maturity in Machine Learning Operations, i.e., MLOps
  • Why DevOps is not the same for ML as it is for software, and why MLOps is needed
  • The ideal teams, stacks, and features to look for to reach Maturity in your ML program

Learn why some companies succeed, while others struggle in AI/ML by seeing the signatures of success across Ideation, Team, Stack, Process, & Outcome in this informative (Hi-res) Infographic.

Infographic: MLOps Maturity Model [M3]

Interpreting The Confusion Matrix

To grasp how we interpret the confusion matrix, there is some terminology that you must first become acquainted with.

  • True Positives (TP): The model predicted positive and the actual label is positive
  • True Negative (TN): The model predicted negative and the actual label is negative
  • False Positive (FP): The model predicted positive and the actual label was negative
  • False Negative (FN): The model predicted  negative and the actual label was positive

Visually, these terms could be presented as follows:

actual prediction

We can also refer to False Positives as Type I errors and False Negatives as Type II errors.

Accuracy:

When we talk of accuracy, we are referring to how close the measured value (what we are predicting) is to the known values. To calculate the accuracy of a model from our confusion matrix we would sum the correct answers (TP + TN) and divide it by the total number of instances (TP + TN + FP + FN).

accuracy

The accuracy of our cat and dog classifier would be 25%.

Precision:

Precision, also known as positive predictive value, informs us of the amount of actual positive labels from all of the labels our classifier has labelled as positive.

precision

The precision of our cat and dog classifier [given cat is positive and dog is negative class]> would be 27%.

Recall:

Recall, also known as sensitivity or the true positive rate (TPR), informs us of the number of positive labels that our classifier correctly labelled as positive.

The recall of our cat and dog classifier [given cat is the positive class and dog is the negative class] would be 30%.

F1 Score:

It’s quite rare that precision and recall are discussed in isolation, and they often tend to have an inverse relationship where optimizing for one metric would reduce the other. In situations where we need to strike a balance between precision and recall, a better known metric to look to is the F1-score, also referred to as the F-measure.

Using the precision and recall scores from the previous section, our F1 score for our cat and dog classifier would be 28%

Final Thoughts…

Whenever we use Machine Learning, it’s important we come up with a way to measure the algorithms performance at our specific task based on the business goals. The confusion matrix is a very useful performance measure for classification tasks which provides practitioners with a visual insight into how their algorithm is performing.

Thank you for reading! Connect with me on Medium, LinkedIn, and Twitter to read more insights I have regarding Data Science and Artificial Intelligence.

Here at Datatron, we offer a platform to govern and manage all of your Machine Learning, Artificial Intelligence, and Data Science Models in Production. Additionally, we help you automate, optimize, and accelerate your ML models to ensure they are running smoothly and efficiently in production — To learn more about our services be sure to Request a Demo.

Infographic

MLOps Maturity Model [M3]

MLOps Maturity Model Infographic Thumbnail

In this Infographic, you’ll learn:

  • The FIVE stages of maturity in Machine Learning Operations, i.e., MLOps
  • Why DevOps is not the same for ML as it is for software, and why MLOps is needed
  • The ideal teams, stacks, and features to look for to reach Maturity in your ML program

Learn why some companies succeed, while others struggle in AI/ML by seeing the signatures of success across Ideation, Team, Stack, Process, & Outcome in this informative (Hi-res) Infographic.

Infographic: MLOps Maturity Model [M3]

whitepaper

Datatron 3.0 Product Release – Enterprise Feature Enhancements

Streamlined features that improve operational workflows, enforce enterprise-grade security, and simplify troubleshooting.

Get Whitepaper

whitepaper

Datatron 3.0 Product Release – Simplified Kubernetes Management

Eliminate the complexities of Kubernetes management and deploy new virtual private cloud environments in just a few clicks.

Get Whitepaper

whitepaper

Datatron 3.0 Product Release – JupyterHub Integration

Datatron continues to lead the way with simplifying data scientist workflows and delivering value from AI/ML with the new JupyterHub integration as part of the “Datatron 3.0” product release.

Get Whitepaper

whitepaper

Success Story: Global Bank Monitors 1,000’s of Models On Datatron

A top global bank was looking for an AI Governance platform and discovered so much more. With Datatron, executives can now easily monitor the “Health” of thousands of models, data scientists decreased the time required to identify issues with models and uncover the root cause by 65%, and each BU decreased their audit reporting time by 65%.

Get Whitepaper

whitepaper

Success Story: Domino’s 10x Model Deployment Velocity

Domino’s was looking for an AI Governance platform and discovered so much more. With Datatron, Domino’s accelerated model deployment 10x, and achieved 80% more risk-free model deployments, all while giving executives a global view of models and helping them to understand the KPI metrics achieved to increase ROI.

Get Whitepaper

whitepaper

5 Reasons Your AI/ML Models are Stuck in the Lab

AI/ML Executive need more ROI from AI/ML? Data Scientist want to get more models into production? ML DevOps Engineer/IT want an easier way to manage multiple models. Learn how enterprises with mature AI/ML programs overcome obstacles to operationalize more models with greater ease and less manpower.

Get Whitepaper